
Accusoft.FormFix5.Net - Updated
Marked/Unmarked Analysis - Principles and Examples
The density of a bubble’s marking is compared to the Threshold property to determine whether or not a bubble is considered marked. If a bubble’s mark density is below this threshold, its MarkState is returned as Unmarked, but, if a bubble’s mark density is above this threshold, its MarkState is returned as Marked. The bubble’s value, measured mark density, and area in the field are also returned. For each segment and for the whole field, a confidence in the marked/unmarked decisions is also returned.
In these examples, assume the Threshold is 25%.
| Example | Mark Density | Sample Image | Return |
| 1 | 0% | 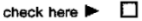 |
UnmarkedSegmentResult, 100% confidence |
| 2 | 10% |
 |
UnmarkedSegmentResult, >80% confidence |
| 3 | 26% |
 |
Value with 35% confidence |
| 4 | 85% |
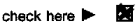 |
Value with 100% confidence |
In these examples, assume the Threshold is 25%.
| Example | Mark Density | Sample Image | Return |
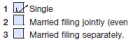
| 1 | 0%, 0%, 0% |
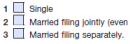 |
UnmarkedSegment Result, 100% confidence |
| 2 | 10%, 5%, 0% |
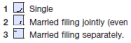 |
UnmarkedSegmentResult, 80-90% confidence |
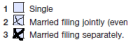
| 3 | 26%, 0%, 0% |
 |
Value (1) with 35% confidence |
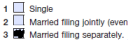
| 4 | 0%, 26%, 80% |
 |
TooManyMarksSegementResult text string (default “~”), confidence 68 (Marked Bubbles 2,3) |
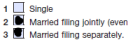
| 5 | 0%, 0%, 85% |
 |
Value (3) with 100% confidence |
| 6 | 0%, 90%, 90% |
 |
TooManyMarksSegementResult text string (default “~”), confidence 100 (Marked Bubbles 2,3) |
In these examples, assume the Threshold is 25%.
| Example | Mark Density | Sample Image | Return |
| 1 | 0%, 0%, 0% |
 |
UnmarkedSegmentResult, 100% confidence |
| 2 | 10%, 5%, 5% |
 |
UnmarkedSegmentResult, >80% confidence |
| 3 | 0%, 26%, 0% |
 |
Value (b) with 35% confidence |
| 4 | 0%, 50%, 50% |
 |
Values (b) and (c) with >80% confidence |
| 5 | 0%, 95%, 95% |
 |
Values (b) and (c) with 100% confidence |